
HHVM's Profile-guided Region JIT
Our initial version of the HHVM JIT didn’t use profile-guided optimizations, and we suspected that we were leaving performance on the table because of that. After adding HHIR and beefing up the JIT backend in 2013, a couple of us embarked on the journey of building a profiling mechanism and leveraging it to improve the JIT’s optimizations and HHVM’s performance. In the summer of 2013, we started a major redesign of the HHVM JIT that we incrementally released in 2014 and 2015 and that continues to be the basis for further improving performance. This post will illustrate the work we did to bring the redesign to fruition and some of the fruitful performance efficiencies we continue to experience today.
In general, knowing how a program behaves at runtime enables a compiler to make better optimization decisions to produce faster code. Profile-guided optimizations (PGO) are a class of optimizations that compilers perform to a program based on profile data collected while observing the program’s execution. The downside of PGO is the complexity of gathering profile data and recompiling the code. This complexity is a drawback for static compilers, and it often causes their users to give up on the benefits of PGO. However, for dynamic/JIT compilers, where the compilation happens automatically under the covers, PGO can be seamlessly integrated without changing the user’s workflow.
There were two main areas where we knew we could use profiling information to improve the HHVM JIT. First, it could provide a general way to obtain more accurate data to improve many optimization decisions that are made at JIT time. Profiling could also provide the JIT with type information to allow it to form larger type-specialized compilation regions. This would overcome the limitations imposed by tracelets, which were the HHVM JIT’s original compilation units. We’ll explain and illustrate these limitations next, and then describe the redesign of the JIT to overcome these issues.
The problem with tracelets
Instead of profiling the program, the initial design of the HHVM JIT simply inspected the live state of the virtual machine (VM) to generate machine code. This approach is core to the concept of a tracelet, a maximal type-specialized bytecode sequence that can be obtained by inspecting the live VM state at one execution point. More specifically, a tracelet ends either (a) when the JIT needs type information about an input value that it can neither infer nor obtain by inspecting the VM local variables and stack slots, or (b) on a branch instruction, for which the JIT can’t infer the direction that will be taken.
The effect of these restrictions imposed by tracelets is better shown in an example. Consider the following PHP function:
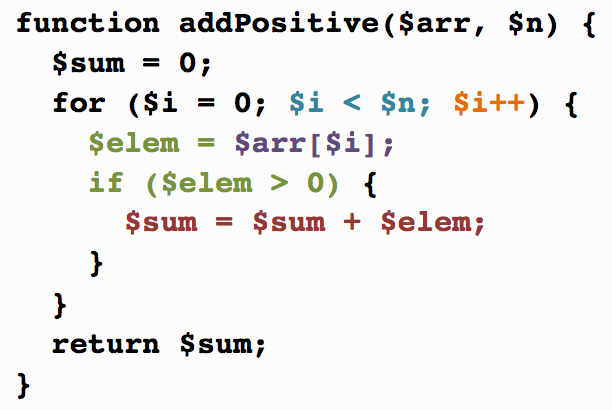
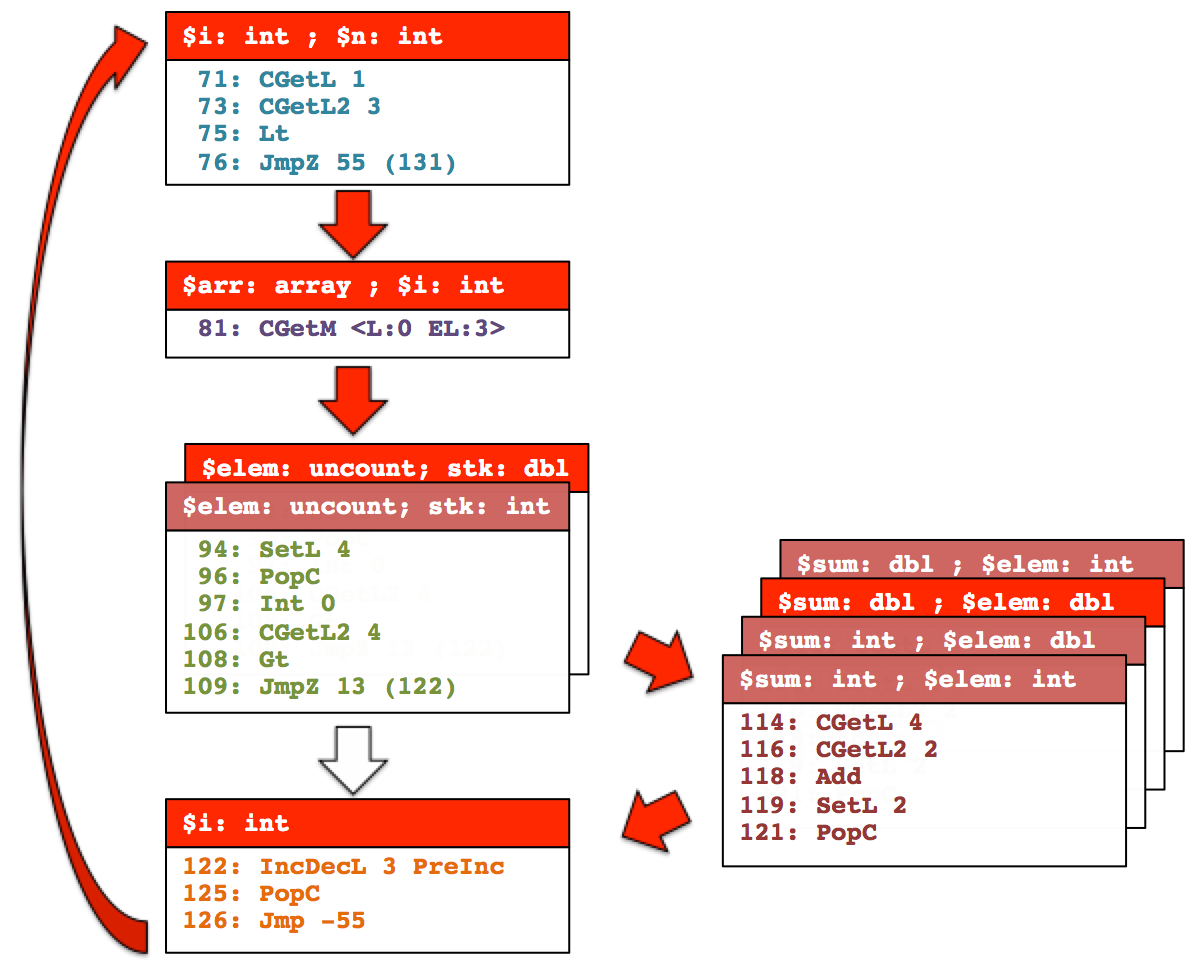
In this example, the source code of the loop uses different colors corresponding to the different tracelets that the JIT formed. Assuming that array $arr contains both integers and doubles, the figure below illustrates the various tracelets and how they’re chained. Each tracelet is represented by a box, with the type guards on the top followed by the bytecode instructions that the tracelet contains. The stacked tracelets show the different tracelets that are formed to handle the different combinations of input types.
One of our main goals with the HHVM JIT redesign was to leverage profiling information to enable compilation of larger code regions to eliminate the inefficiencies resulting from tracelets and further improve HHVM’s performance. During the JIT compilation, each tracelet was translated to machine code independently. This resulted in two sources of inefficiencies in the generated code. First, entering and exiting a tracelet incurs overheads because the program state is shuffled between memory and registers and because of type guards, where successive tracelets result in repeated type checks to input values that don’t change. Second, because the JIT optimized each tracelet independently, it couldn’t perform optimizations to eliminate other redundancies across tracelets, such as hoisting loop-invariant computations out of the loop in the example above. The size of the compilation unit effectively restricts the scope of JIT optimization passes, such as redundant load elimination, global value numbering, and reference-count elimination.
Transforming the HHVM JIT into a multi-gear system
Although PGO can be performed transparently in a JIT compiler, profile data still imposes additional memory and CPU overheads. This presented a challenge for us because we needed to keep the profiling CPU overhead at a minimum in order to collect profile data while the web server was simultaneously serving production traffic.
To keep the profiling overhead minimal, we chose to turn the HHVM JIT into a multi-gear system, using JIT’d code to collect profile data efficiently. For the first profiling gear, we leveraged the tracelet JIT that we had already built. By simply inserting a counter after the type guards in each tracelet, we can efficiently collect both block-execution frequencies and type information for the input values. After sufficient profile data is collected, a second optimizing gear can retranslate the machine code more efficiently, forming larger compilation regions, which are fed into the JIT backend.
We illustrate the effect of enabling larger compilation regions on the example above. Assuming the most frequent execution path follows the arcs and blocks highlighted in the figure above, the optimizing gear can decide to select the hot blocks and recompile them as a single, larger optimized translation.
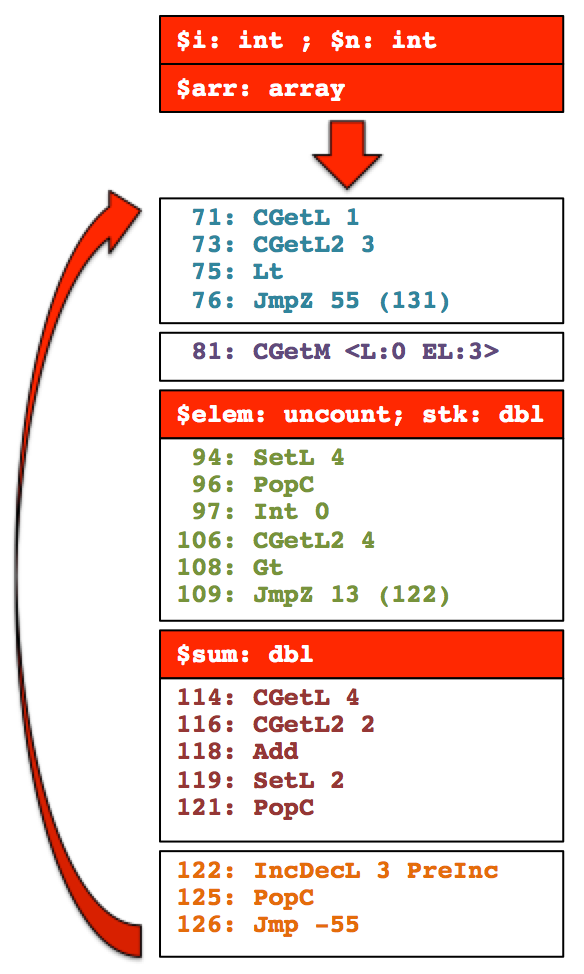
This example illustrates how redundant type checks can be eliminated or hoisted out of the loop, but the same benefit applies to other operations such as memory accesses and other computations that the JIT determines to be either redundant or unnecessary.
In addition to the benefit of compiling larger regions illustrated above, this multi-gear system also allows the JIT to make better decisions than what is possible by simply inspecting the live VM state. The realm of opportunities here is very broad, and custom profiling code can be applied to gather whatever data is desired during profiling. Some of the optimizations that we’ve built so far by leveraging this general framework include:
- code layout
- hot/cold code splitting
- dynamic method dispatch
- partial function inlining
- guard relaxation
- specialization of array operations for different array and element types
- predicting the position of elements inside PHP arrays
Implementation, timeline, and performance
We started working on this project in the summer of 2013. The initial steps were to build the basic profiling infrastructure, add the ability to recompile functions, and start generalizing the JIT to translate arbitrary code regions instead of just tracelets. We knew that this last task in particular was going to be very challenging, because the entire JIT backend was built around the concept of tracelets. Since tracelets were intrinsically acyclic and didn’t have merge points at the bytecode level, many of the analysis and optimization passes could be made simpler (e.g., no iterative data-flow analyses were needed).
As an initial step, we started using profiling data to form longer straight-line traces, which were basically longer tracelets and therefore didn’t violate assumptions in the JIT optimizer and backend. We enabled this JIT mode by default in the first half of 2014, and by the end of 2014 it delivered about a 5 percent reduction in CPU usage in our webservers. During the second half of 2014, we focused on generalizing the JIT optimizer and backend to handle arbitrary regions. Most of the optimization passes had to be either fixed or completely rewritten. By the spring of 2015, the JIT was finally able to handle regions with arbitrary control flow, and this feature was enabled by default. Since then, we’ve continued to exploit opportunities enabled by this PGO framework, improving optimizations to benefit from profiling information and enabling inlining of functions with arbitrary control flow. To this date, this entire redesign of the HHVM JIT has improved the CPU usage for running Facebook by about 18 percent.
Future work
In this post, we described how we redesigned the HHVM JIT to further improve its performance. Although this redesign has already delivered double-digit performance improvements, we believe there are still plenty of opportunities to further leverage profiling information to boost HHVM’s performance even more. For example, profiling information can be useful to better guide some decisions that are still done statically in the JIT (e.g., the likelihood of branches), to improve the placement of spill code emitted by the register allocator, and to guide a more intelligent layout for the entire translation cache. We will explore these and other ideas to leverage this JIT architecture as we continue to focus on improving HHVM’s performance.